 Yusral
Reports
How much work comes in and goes out, how quickly your team replies, what is left waiting and how the work is shared out.
Reports are part of the Professional subscription. You see them if your role allows it: by default the owner, admins and managers. An administrator can also give the permission to a custom role.
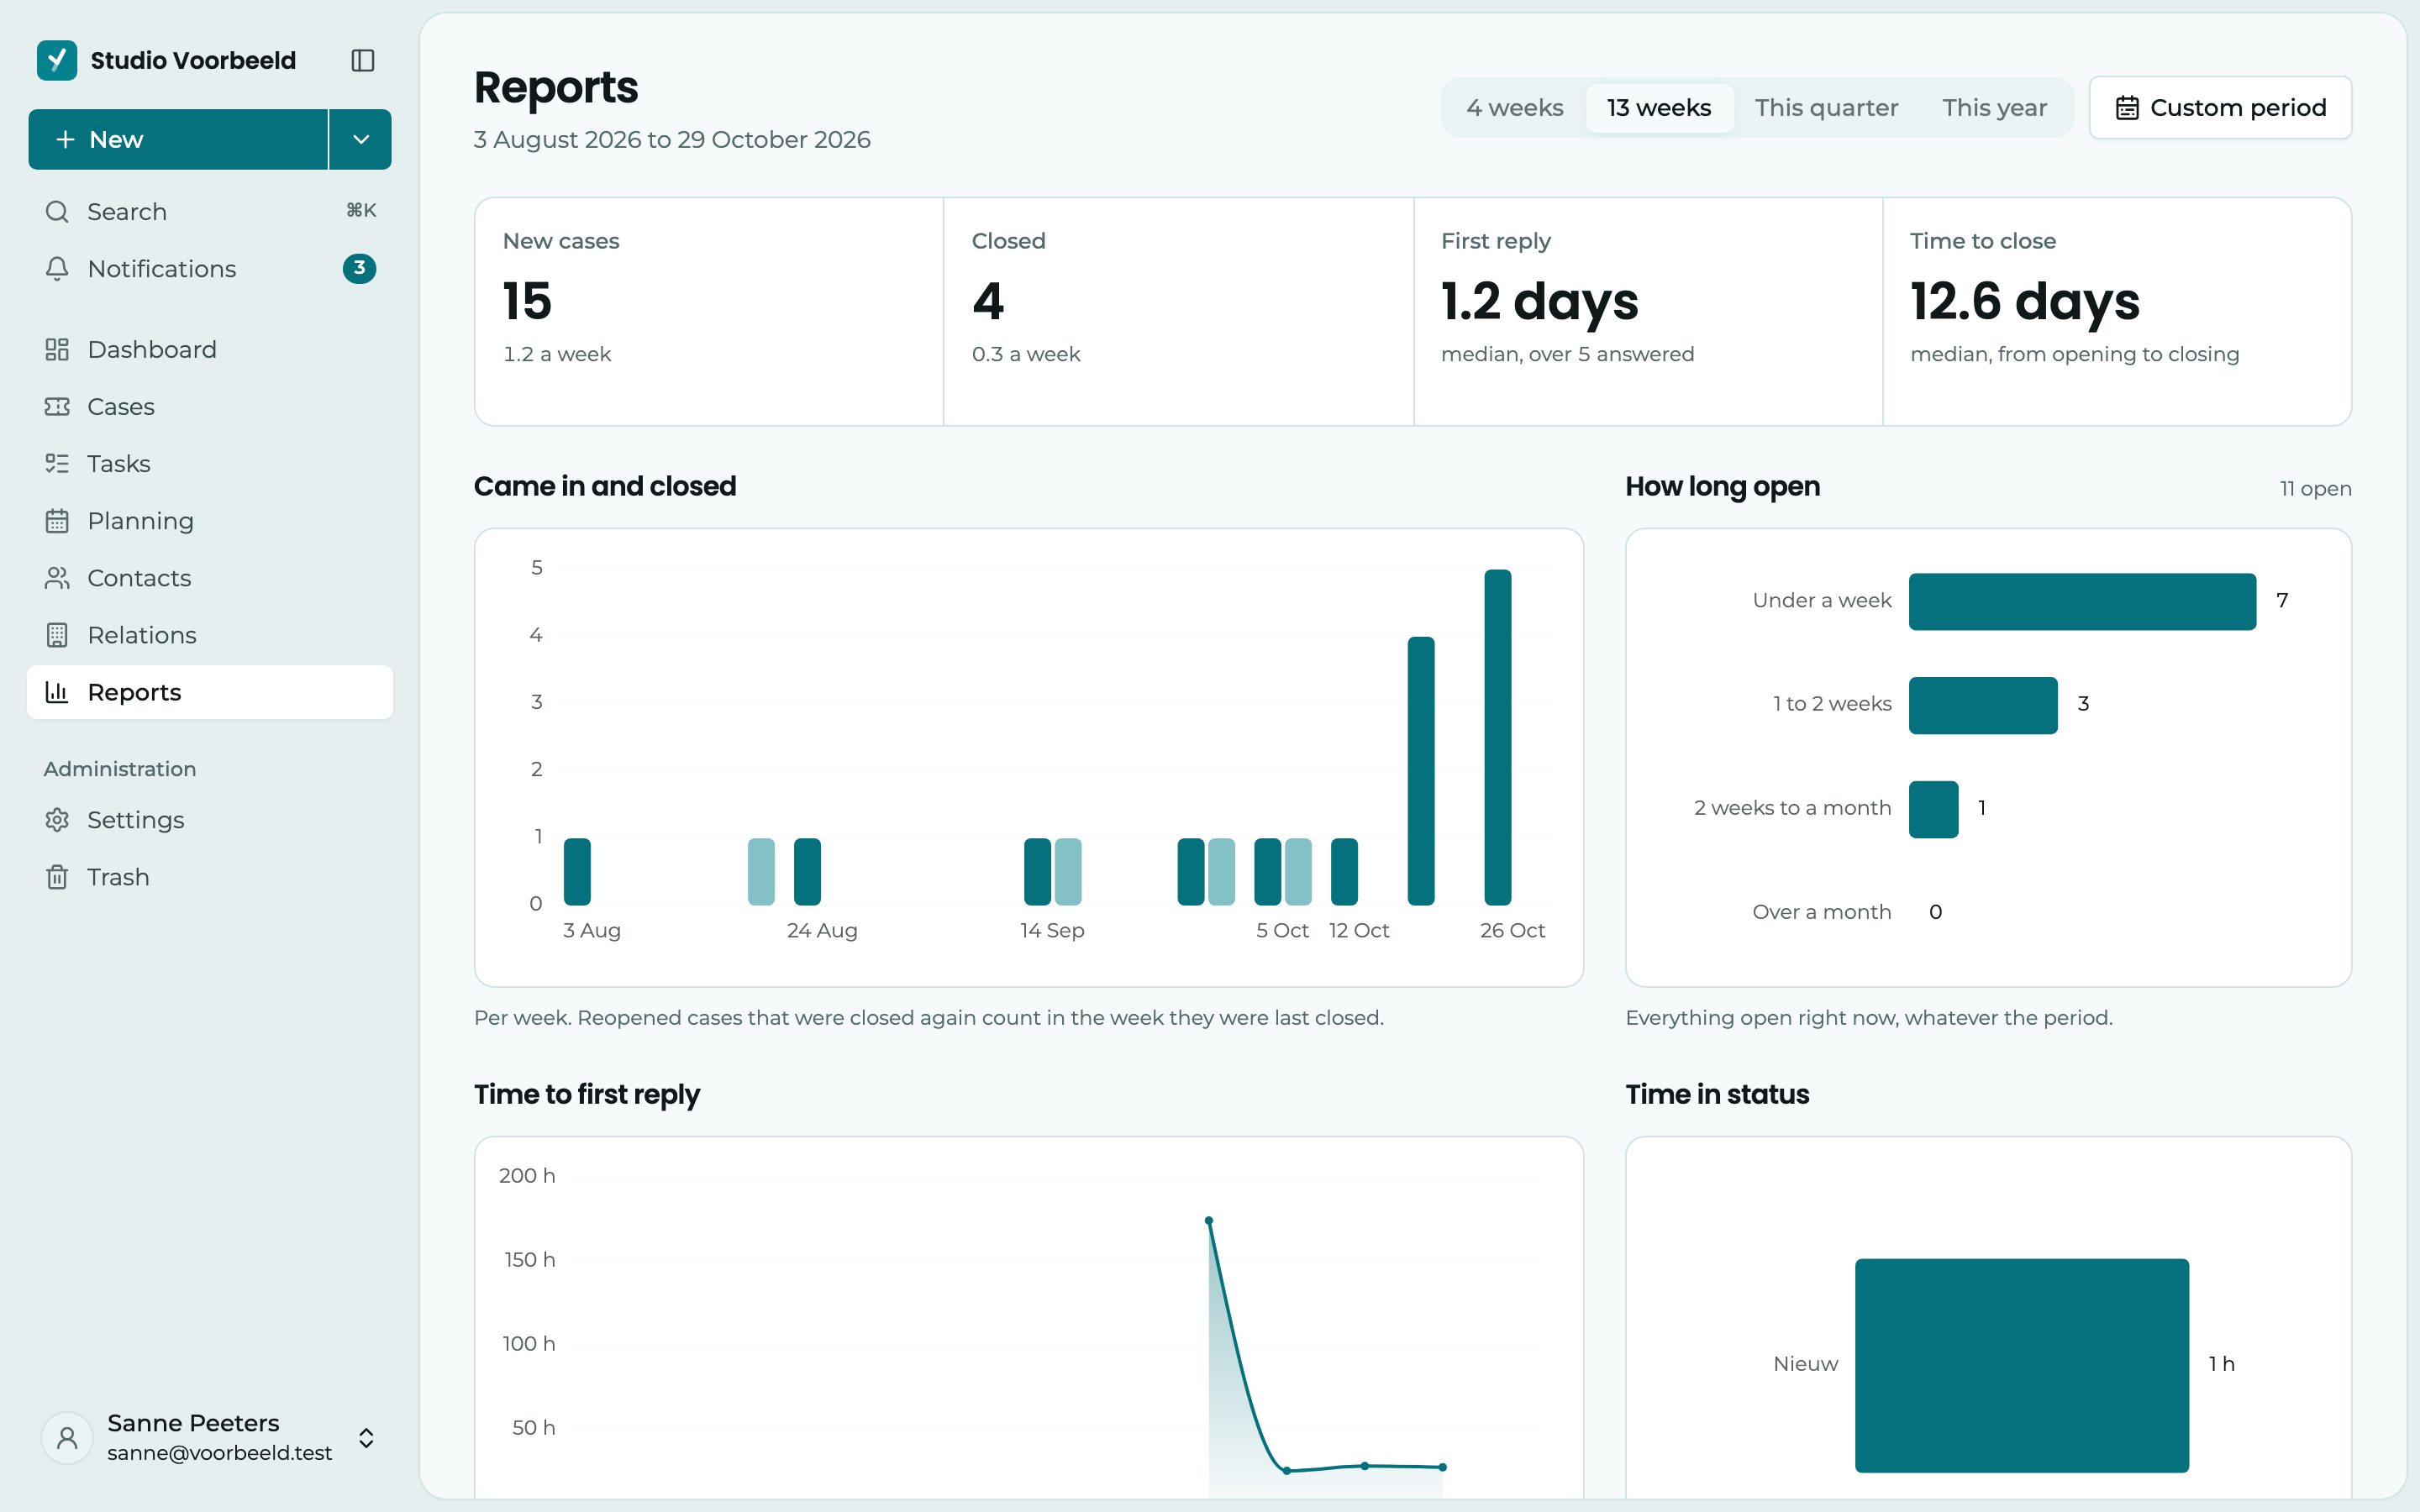
Click Reports in the menu. You see how many cases come in and are closed, how quickly your team sends the customer a first reply, what has been open for a long time and who has what on their plate.
On the Starter subscription, Reports appears in the menu with the Pro label. You then see what the page does, and an administrator can change the subscription.
Choose the period
1 At the top, you choose the period: This week, This month, This quarter (the default) or This year. Each period runs from its first day up to today: this week from Monday, this month from the first. Below the title, you see exactly which days that covers.
The charts show a week and a month per day, a quarter per week and a year per month.
2 For a different period, such as last week, click Custom period. Choose a start and end day, up to two years back, and click Show period. A period of up to a month is shown per day, up to half a year per week, and a longer one per month. A week starts on Monday.
The key figures
3 At the top are four figures for the chosen period:
| Figure | What it counts |
|---|---|
| New cases | How many cases came in, with the average per day or per week. |
| Closed | How many cases were closed, with the average per day or per week. |
| First reply | How long a customer waits on average for the first reply. It is the median: half of the cases got a reply sooner. |
| Time to close | How long a case was open, from opening to closing, also as a median. |
Below each figure, you see how it compares with the same days of the period before, such as 12% more than last month or 8% faster than last year. So if you look at This month on the 10th, you compare with the first ten days of last month. If there was too little in that period to compare with, nothing is shown.
The charts and tables
- Came in and closed: per day, week or month, how many cases are new and how many were closed. A case that was reopened and closed again counts at the last time.
- How long open: everything that is open now, split into Under a week, 1 to 2 weeks, 2 weeks to a month and Over a month. This chart looks at today, regardless of the chosen period.
- Time to first reply: the median per day, week or month, up to the first email that actually went out to the customer. Notes don't count, and it is about calendar hours, not working hours.
- Time in status: how long cases stay in each status on average before they move on. Closed cases don't count here.
- Workload: per assignee, how many cases are Open and Overdue now, and how many were Closed in the chosen period. The cases nobody has yet are also included, as Unassigned.
- Relations with the most cases: which customers had the most new cases in the chosen period, and how many of those are still open.
Export
With Export at the top, you save the period you see on screen:
- PDF: an A4 report with the key figures and all tables.
- Excel (.xlsx): a workbook with a sheet per table, to do your own calculations.
From a number to the cases
Click a number or a bar, and you see the cases behind it in the cases overview. Above the list, you then see which filter is on, for example Opened 3 Feb 2026 to 9 Feb 2026. Click the cross to remove that filter.
If you later go to Cases through the menu, the list is back the way you had it yourself.